Heat Pump COP Explained: What 91 Ratings at 5°F Show
Heat pump COP is heat out divided by electricity in. What 91 certified mini-splits publish at 5°F, how to turn COP into watts, and what it cannot tell you.
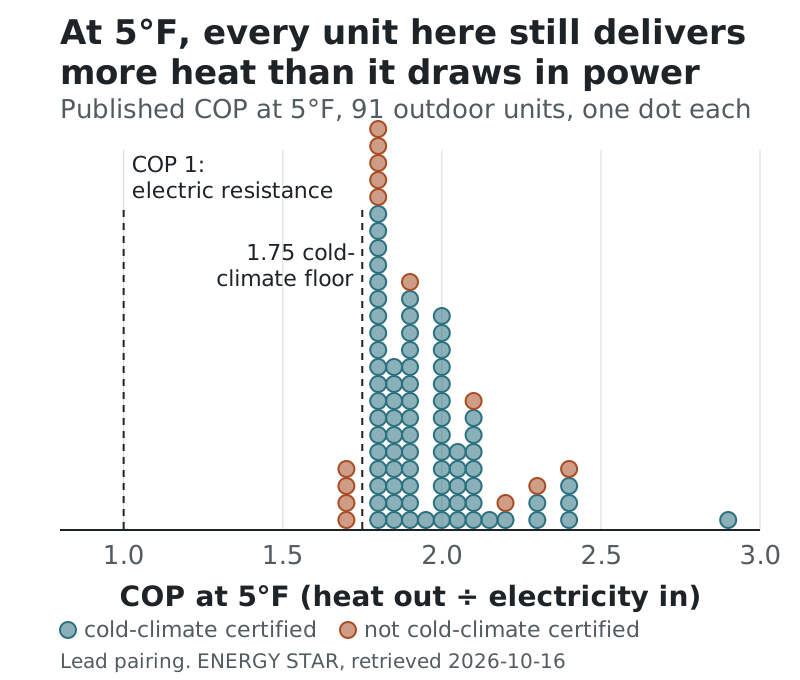
Heat pump COP, the coefficient of performance, is the heat a system delivers divided by the electricity it draws, both in the same units, at one stated operating condition. A COP of 2 means two units of heat out for every unit of electricity in. Among the 91 certified ductless outdoor units on this site that publish a COP at 5°F, every one is above 1.7, the median is 1.90, and the highest is 2.89 — so even at 5°F, each of them still delivers nearly twice the heat a plain electric heater would from the same electricity.
That is the short answer. This guide covers how COP is defined, how it relates to HSPF2, what the published 5°F figures look like across a real set of certified systems, how to turn a COP into watts and dollars, and the one thing it cannot tell you, which is whether the system makes enough heat.
What heat pump COP measures
ENERGY STAR's key product criteria define COP as the average heating rate delivered divided by the average electrical power consumed, a dimensionless ratio that must come from a single test or a single set of operating conditions. That last clause matters more than it looks. A COP is always a COP at something: a temperature, an indoor condition, a compressor speed. Two COP figures measured at different conditions are not comparable, however similar they look on a spec sheet.
The reference point that makes the number intuitive is electric resistance heat. A baseboard heater or the backup strip in an air handler turns one kilowatt-hour of electricity into one kilowatt-hour of heat, 3,412.14 BTU. That is a COP of 1. A heat pump does better because it moves heat from outdoor air rather than making it from electricity, and COP is the multiple. At a COP of 2, one kilowatt-hour drawn from the wall delivers 6,824 BTU to the room.
The ENERGY STAR Certified Heat Pumps dataset publishes one COP figure per certified pairing: cop_at_5_f, the COP at a 5°F outdoor temperature. ENERGY STAR's cold-climate criteria require it to be measured under the Appendix M1 H42 test. The dataset's own column metadata carries no description for that field, which this site records on its methodology page; the figures are printed as published.
Heat pump COP vs HSPF2: the same ratio in different units
HSPF2 is also heat out divided by electricity in. The difference is in the units and the period. HSPF2 is total heat delivered over a modelled heating season, in BTU, divided by the electricity consumed over that season, in watt-hours, so its unit is BTU per watt-hour. Converting it to a dimensionless seasonal COP takes one division:
seasonal COP = HSPF2 ÷ 3.41214
The running-cost calculator on this site prints this conversion with every scenario. Across the 92 outdoor units here:
| Published HSPF2 | Where it sits in this set | Implied seasonal COP |
|---|---|---|
| 15.0 | Highest | 4.40 |
| 10.2 | Median | 2.99 |
| 8.3 | Lowest | 2.43 |
Put the two numbers side by side and the median system looks like a COP-3 machine on the seasonal rating and a COP-1.9 machine at 5°F. Neither is wrong. HSPF2 averages a season of mostly mild hours under the rating procedure; COP at 5°F is one hard hour. The relationship between them is loose: across the 91 units that publish both, HSPF2 and COP at 5°F correlate at only 0.32. A high seasonal rating does not reliably mean a high cold-weather COP.
What 91 certified units publish at 5°F
Every figure below is the lead pairing's published COP at 5°F from the ENERGY STAR Certified Heat Pumps dataset, retrieved 2026-10-16. One unit in the set, the Mitsubishi Electric MUZ-GL15NAH***, publishes no COP at 5°F, so it is excluded rather than estimated.
| COP at 5°F | Outdoor units |
|---|---|
| 1.70 – 1.79 | 4 |
| 1.80 – 1.89 | 36 |
| 1.90 – 1.99 | 14 |
| 2.00 – 2.49 | 36 |
| 2.50 and above | 1 |
The distribution has a wall at 1.80: 24 units publish exactly that figure, 19 of them cold-climate certified. It sits just above ENERGY STAR's cold-climate floor of 1.75, which is what you would expect from equipment engineered to clear a threshold rather than to maximise one number.
The bottom of the range is four LG units, the KUSAE091A, KUSAE121A, KUSAE181A and KUSAE241A, each at 1.70. All four are certified ENERGY STAR heat pumps and none carries the cold-climate designation. The top is the Carrier 38MPRBQ18AA3 at 2.89, the only unit above 2.5, followed by the Mitsubishi Electric MUZ-FS09NA*** and MUZ-FS09NAH*** at 2.40.
Split by certification, the cold-climate units publish 1.80 to 2.89 with a median of 1.90, and the units without the designation publish 1.70 to 2.39 with a median of 1.80. The ranges overlap heavily. Four units without the designation publish 2.10 or higher, the CanAir C25SCH12H21 at 2.39 and three Daikin RXF models among them. They miss the designation on capacity, not on COP, which the cold-climate criteria guide sets out unit by unit.
Does nominal size change COP at 5°F?
Less than you might expect, and not in one direction. Grouping the same 91 units by nominal size class:
| Nominal class, BTU/h | Units with a 5°F COP | Lowest | Median | Highest |
|---|---|---|---|---|
| 6,000 | 3 | 1.84 | 2.00 | 2.39 |
| 9,000 | 30 | 1.70 | 1.90 | 2.40 |
| 12,000 | 24 | 1.70 | 1.90 | 2.39 |
| 15,000 | 11 | 1.80 | 2.00 | 2.03 |
| 18,000 | 14 | 1.70 | 1.92 | 2.89 |
| 24,000 | 8 | 1.70 | 1.80 | 1.90 |
| 30,000 | 1 | 1.80 | 1.80 | 1.80 |
The medians sit in a narrow band from 1.80 to 2.00. The largest classes here have the lowest medians, but the single highest COP in the set belongs to an 18,000 BTU/h unit. With 8 units in the 24,000 class and one in the 30,000 class, the sample is too thin to say anything firmer about size. What it does show is that the spread inside a class, 1.70 to 2.40 among 9,000 BTU/h units, is wider than the difference between classes, so a COP comparison is most useful between systems of the same size.
What the COP figure leaves out
A published COP at 5°F is one test result, and it is worth being clear about what the test does and does not include.
It is a single steady condition. ENERGY STAR's definition requires the COP to come from a single test or a single set of operating conditions. Real winter operation moves through many conditions in an hour.
Defrost happens in real operation. At cold outdoor temperatures, frost builds on the outdoor coil and the system periodically reverses to melt it. The Department of Energy's Energy Saver guidance recommends demand-defrost controls to cut unnecessary defrost cycles and the energy they use, and notes that shielding the outdoor unit from high winds avoids defrost problems. How much defrost affects any particular installation is not something a rating states.
It describes the outdoor and indoor pair. The figure belongs to one certified pairing. The Midea 37MAHAQ06AA3 publishes COPs at 5°F of 2.39 and 2.40 across its three certified indoor pairings, and the Carrier 38MPRBQ09AA3 1.80 and 1.85 across its three; small differences, but proof that the outdoor model number alone does not fix the figure. Each model page on this site lists every certified pairing with its own COP.
It stops at 5°F. The dataset publishes no COP at lower temperatures. Anything quoted for −5°F or −13°F comes from somewhere else, and this site does not repeat it.
A heat pump COP calculator you can do on paper
Three formulas cover nearly every question COP can answer. Each uses 3.41214, the number of BTU in one watt-hour.
- COP from a measured output and input: COP = heat output in BTU/h ÷ (power in watts × 3.41214).
- Power drawn at a published point: watts = heat output in BTU/h ÷ (COP × 3.41214).
- Electricity per million BTU delivered: kWh = 1,000,000 ÷ (COP × 3,412.14).
Applied to published figures at 5°F:
| Outdoor unit | 5°F capacity, BTU/h | COP at 5°F | Implied draw at 5°F |
|---|---|---|---|
| Carrier 38MPRBQ18AA3 | 24,000 | 2.89 | about 2,434 W |
| Mitsubishi Electric MUZ-FS12NA*** | 14,700 | 2.30 | about 1,873 W |
| Daikin RXF12BVJU* | 9,500 | 2.10 | about 1,326 W |
| LG KUSAE121A | 8,400 | 1.70 | about 1,448 W |
| Daikin RXF12AXVJU | 6,600 | 2.32 | about 834 W |
Formula 3 gives the cost side. At a COP of 1.75, the cold-climate floor, delivering one million BTU takes about 167.5 kWh. At a COP of 1, it takes about 293.1 kWh. The U.S. Energy Information Administration reports an average residential electricity price of 17.30 cents per kWh for 2025; at that price, those million BTU cost about $28.97 at COP 1.75 and about $50.70 at COP 1. Your own price belongs in place of the average.
These are rating-condition results. The draw figures describe each unit at the 5°F test point, not an average winter hour, and not any particular installation.
High COP is not the same as enough heat
The table above has an uncomfortable row in it. The Daikin RXF12AXVJU publishes a COP at 5°F of 2.32, the sixth-highest in the set, and the lowest 5°F capacity of any 12,000 BTU/h class unit here: 6,600 BTU/h. Its sibling, the RXF12BVJU*, publishes a lower COP of 2.10 and 9,500 BTU/h. Both publish the same HSPF2 of 10.2.
If the room needs 9,000 BTU/h at 5°F, the first unit covers 6,600 and something else has to supply the other 2,400. If that something is electric resistance at COP 1, it draws about 703 watts on top of the heat pump's 834, and the combined system delivers 9,000 BTU/h for roughly 1,537 watts: an effective COP of about 1.72, below the unit's own published 2.32. The second unit covers the whole 9,000 itself at its published COP.
COP describes the quality of the heat the system makes. Capacity describes the quantity. The capacity at 5°F guide covers the quantity side in detail, and the balance point guide shows how the two combine once a load is involved.
How COP figures get misread
Comparing COPs from different conditions. A manufacturer brochure may quote a COP at 47°F, at a reduced compressor speed, or as an "up to" figure. The dataset publishes COP at 5°F only. Comparing a 47°F COP from one source with a 5°F COP from another compares two different questions.
Reading the seasonal COP as a winter COP. HSPF2 ÷ 3.41214 is a perfectly good number for ranking systems over a modelled season. It overstates what the system does on the coldest night by a wide margin: on this site, the median is about 2.99 seasonal against 1.90 at 5°F.
Treating a rating as a forecast. COP at 5°F comes from a laboratory test at fixed temperatures and airflow. Defrost cycles, installation quality and controls all shape what an installed system does. The U.S. Department of Energy's Energy Saver guidance on air-source heat pumps notes that systems with correct refrigerant charge and airflow generally perform close to their rated figures, which is a statement about installation as much as equipment.
Assuming more is always available. The U.S. Department of Energy's Residential Cold Climate Heat Pump Technology Challenge set a target of a COP of at least 2.4 at 5°F for systems of 24,000 to 48,000 Btu/h, with 100% of 47°F capacity retained at 5°F. Three units in this set publish both a COP of 2.40 or more and at least 100% retention, the Carrier 38MPRBQ18AA3 and the two Mitsubishi Electric MUZ-FS09 models. That is a comparison of published numbers only; the challenge was written for larger systems, and this site makes no claim that any of these units meets it.
Using heat pump COP to compare two systems
A sequence that keeps COP in its place:
- Confirm both figures are COP at 5°F from the certification record. Look the pairing up in the certified systems register and read the COP from the spec table, which prints the ENERGY STAR record ID it came from.
- Check the capacity at 5°F first. If either system cannot cover the load at your coldest temperatures, its COP describes only the part of the job it does.
- Then compare COP. Between two systems that both cover the load, the higher COP at 5°F draws less electricity at that point. Formula 2 above converts the difference into watts.
- Use HSPF2 for the season. For an annual cost scenario, the seasonal figure is the right input. The calculator takes HSPF2 directly and prints the implied seasonal COP beside the result.
For a fuller account of which rating answers which question, SEER2 vs HSPF2 sets out all five published figures together. Heat pump COP is the clearest of them — heat out over electricity in — and the published 5°F figure is the most useful version of it, as long as it is read beside the capacity it was measured at.
Sources
- ENERGY STAR Certified Heat Pumps, U.S. Environmental Protection Agency, Socrata dataset
83eb-xbyy. Retrieved 2026-10-16. Every COP, capacity and HSPF2 figure for individual units, and every count, median and correlation, which are arithmetic on those published values. - ENERGY STAR, Heat Pump Equipment Key Product Criteria. Read 2026-10-17 for the definitions of COP and HSPF2, the H42 test reference, and the 1.75 COP at 5°F cold-climate floor.
- U.S. Energy Information Administration, Electricity explained: Factors affecting electricity prices. Read 2026-10-17 for the 2025 average residential price of 17.30 cents per kWh.
- U.S. Department of Energy, Energy Saver: Air-Source Heat Pumps. Read 2026-10-17 for the statement on refrigerant charge, airflow and rated performance.
- U.S. Department of Energy, Residential Cold Climate Heat Pump Technology Challenge, 2024 Peer Review presentation. Read 2026-10-17 for the challenge's COP and capacity targets at 5°F.
Frequently asked questions
What is a good COP for a heat pump at 5°F?
ENERGY STAR's cold-climate criteria set the floor at 1.75, measured under the Appendix M1 H42 test. Among the 91 certified ductless outdoor units on this site that publish the figure, values run from 1.70 to 2.89 with a median of 1.90, and 37 units publish 2.00 or more. Only three publish 2.40 or higher. A figure in the low 2s is therefore above the middle of this set, but COP says nothing about how much heat the unit still makes, so read it beside the capacity at 5°F.
How do I convert HSPF2 to COP?
Divide HSPF2 by 3.41214. HSPF2 is measured in BTU per watt-hour and one watt-hour is 3.41214 BTU, so the division turns it into a dimensionless ratio. An HSPF2 of 10.2, the median on this site, is a seasonal COP of about 2.99. That is a season-long average under the rating procedure, so it will always look higher than a COP measured at a single cold test point such as 5°F.
Can I use COP to work out how many watts a heat pump draws?
Yes, at the condition the COP was measured. Watts drawn equals heat output in BTU per hour divided by the product of COP and 3.41214. A unit publishing 14,700 BTU/h at 5°F with a COP of 2.3 works out to about 1,873 watts at that test point. It is arithmetic on two published figures, not a measurement of any installed system, and the draw at other temperatures or part load will differ.
Why is COP at 5°F so much lower than the seasonal COP?
Because they describe different conditions. HSPF2, and the seasonal COP derived from it, averages a modelled heating season in which most hours are mild. COP at 5°F is one cold test point, where the heat pump has less heat in the outdoor air to move. On this site the median seasonal COP implied by HSPF2 is about 2.99, while the median published COP at 5°F is 1.90.
Does a higher COP at 5°F mean a lower heating bill?
Not on its own. COP measures efficiency while the system is running at that point; it does not say whether the system makes enough heat. The Daikin RXF12AXVJU publishes a COP at 5°F of 2.32 but only 6,600 BTU/h, while the RXF12BVJU* publishes 2.10 and 9,500 BTU/h. If the house needs more heat than the first can make, the shortfall goes to backup heat at a COP of about 1, and the combined cost can end up higher.